Applying Load to the Cluster
| Mule Runtime Engine versions 3.5, 3.6, and 3.7 reached End of Life on or before January 25, 2020. For more information, contact your Customer Success Manager to determine how you can migrate to the latest Mule version. |
| You can now easily create a cluster through the Runtime Manager UI. See Creating and Managing Clusters. |
With a functional application running on a Mule cluster, we can send calls to the application to apply load and see the cluster work to manage it. Use the WidgetUI Web application to send calls to the cluster-demo-app, then witness the cluster’s activities.
-
Open a new tab or window of your browser, then go to
http://localhost:8080/widgetUI/(see image below). Note that at launch, none of the panes contain data as the cluster-demo-app has not yet processed any requests.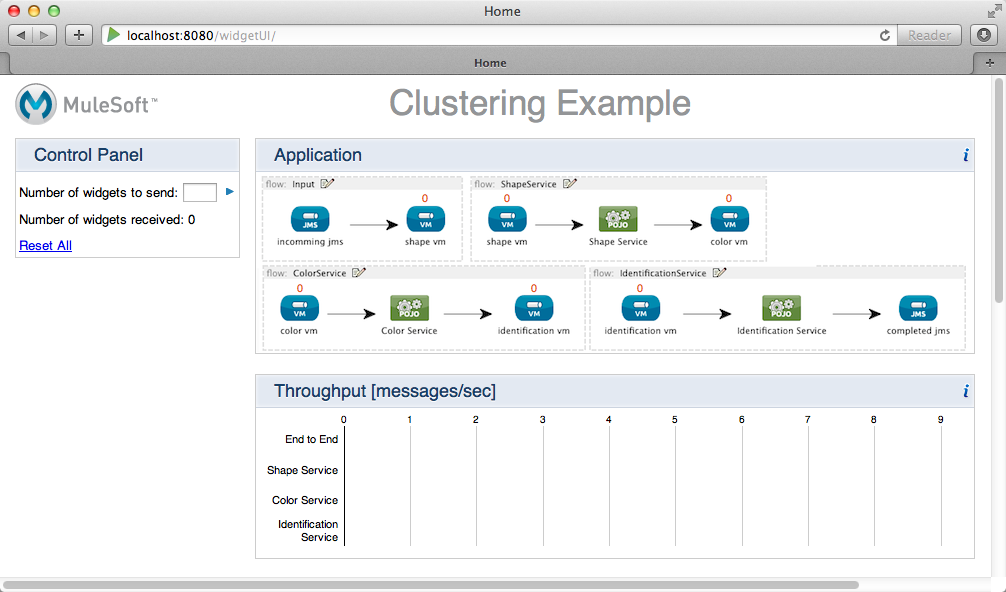
-
The Application Flows pane displays a graphical view of the four flows in the cluster-demo-app:
-
Input -
ShapeService -
ColorService -
IdentificationService.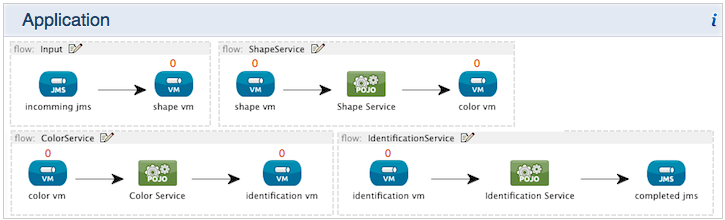
-
-
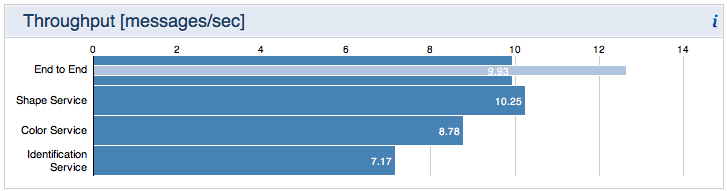
The Throughput pane displays the average number of messages the Mule cluster processes each second.
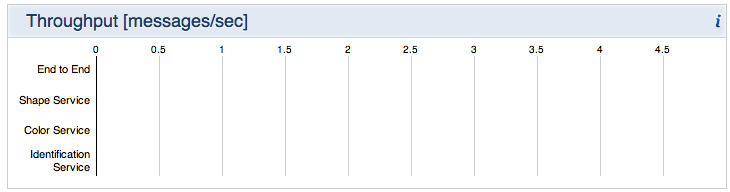
The Throughput pane does not display data for the Inputflow because it does not process messages; it only moves a message from the JMS queue to the VM queue. -
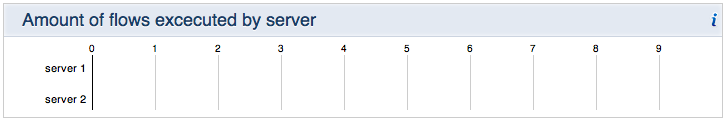
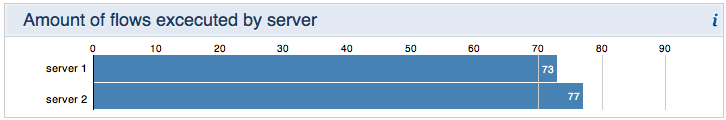
The Amount of flows executed by server pane displays the number of times each server in the cluster finishes processing one of the four flows in the application.
-
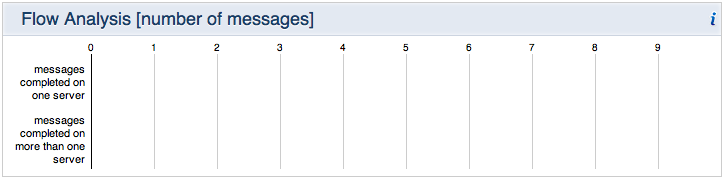
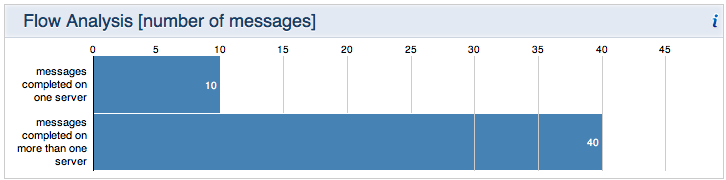
The Flow Analysis pane displays the number of messages (i.e. widgets, in this case) the cluster-demo-app processes on one server, and the number of messages the app processes on multiple servers in the cluster.
-
The Time to Complete Processing of Widget pane displays:
-
the average amount of time the Mule cluster takes to process one widget through All Flows in the cluster-demo-app
-
the average amount of time Mule takes to process one widget through all flows using only one server.
-
the average amount of time Mule takes to process one widget through all flows using more than one server in the cluster.

-
-
-
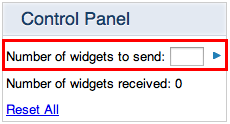
In the Control Panel, in the field labeled Number of widgets to send, enter a number between 50 and 100 to indicate the number of “widgets” the Web app should send to the cluster-demo-app.
-
Press enter, or click the > button to send calls to the application. The cluster-demo-app begins processing the widgets on the cluster of Mule servers. The panes on the WidgetUI dynamically display data about how the Mule cluster is processing messages in the flows. When the cluster-demo-app completes the request (i.e. processes all widgets), the panes' information becomes static.
-
In the WidgetUI, click Reset All to reset the statistics in the user interface. (Resetting does not remove all the messages that the Web app sent to the cluster-demo-app; it resets the statistics on the Web app only.)
-
Repeat steps 2 - 3 above to send more calls to the cluster-demo-app to process different quantities of widgets.
Analyzing the Data
The following details describe the cluster’s activity as a result of having processed a request for 50 widgets.
Throughput
Displaying the average number of messages the Mule cluster processes each second, the Throughput pane indicates that:
-
Mule processed an average of 9.93 messages (i.e. widgets) per second through all four flows in the cluster-demo-app
-
the
ShapeService,ColorServiceandIdentificationServiceflows each processed an average of 10.25, 8.78, 7.17 messages per second, respectively.The dark blue bars indicate average throughput; the light blue bars illustrate instantaneous throughput.
Amount of flows executed by server
This pane demonstrates how Mule balances the processing load between servers in the cluster. The data indicate that:
-
server 1executed 73 flows -
server 2executed 77 flows
This pane illustrates how Mule moves a message back and forth between servers to complete processing. The chart indicates that each server processes roughly the same number of flows, illustrating Mule’s ability to efficiently balance the load between nodes.
Flow Analysis
This pane illustrates how frequently Mule used more than one server in the cluster to process messages. The data indicate that:
-
Mule processed only 10 messages using just one of the servers in the cluster
-
Mule processed 40 messages using both of the servers in the cluster
The cluster-demo-app running on the cluster favors multi-node message processing so as to better demonstrate load balancing between nodes.
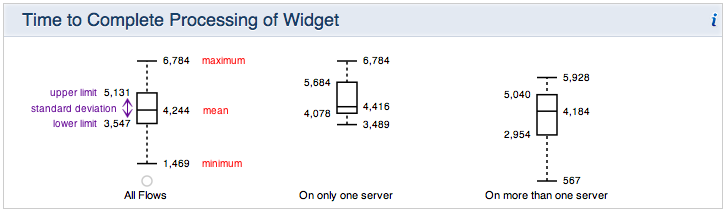
Time to Complete Processing of Widget
The Time to Complete Processing of Widget pane illustrates the amount of time (milliseconds) it takes Mule to process one widget through the flows in the cluster-demo-app. The data indicate the maximum, mean, and minimum processing times, as well as the standard deviation to illustrate dispersion from the mean.
-
All Flows illustrates the metrics for all the flows Mule processed in the cluster, regardless of which server it used to process the flows.
-
On only one server illustrates the metrics for the flows Mule processed using only one server, either
server 1orserver 2. -
On more than one server illustrates the metrics for the flows Mule processed using multiple servers in the cluster (in this case, both servers).