Witnessing Failover
| Mule Runtime Engine versions 3.5, 3.6, and 3.7 reached End of Life on or before January 25, 2020. For more information, contact your Customer Success Manager to determine how you can migrate to the latest Mule version. |
| You can now easily create a cluster through the Runtime Manager UI. See Creating and Managing Clusters. |
To observe how the Mule cluster handles a node failure and continues processing messages, apply a heavy processing load to the cluster, then manually kill one of the two nodes in the cluster.
| Read through all the steps in this procedure before beginning. To witness failover in the Mule cluster, you must be prepared to quickly "kill" one server in the middle of processing. |
-
Ensure that you have the following three windows or tabs open on your screen:
-
a browser window or tab which displays the WidgetUI at
http://localhost:8080/widgetUI/ -
a browser window or tab which displays the Mule Management Console at
http://localhost:8585/mmc/#dashboard -
a Terminal or Console window which displays one of the running servers in the cluster (in this example, server1).
-
-
In the WidgetUI, click Reset All to reset the statistics in the user interface. (Resetting does not remove all the messages that the Web app sent to the cluster-demo-app; it resets the statistics on the Web app only.)
-
In the WidgetUI, enter
1000in the Number of widgets to send field, then press enter. -
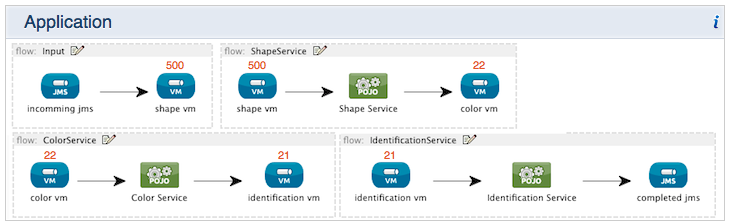
Observe, for a moment, the dynamically changing data in the panes on the WidgetUI. The red numbers in the Application pane indicate the number of messages moving through the endpoints in the flows on the cluster-demo-app.
-
Quickly access your Terminal or Console window, then press Control+C TWICE to forcefully and immediately stop the server. This simulates the failure of one node in the cluster.
-
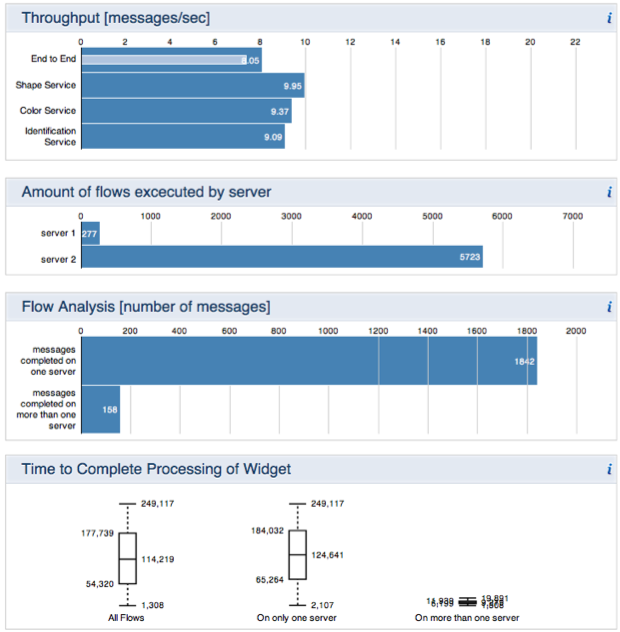
Return to the WidgetUI to observe the cluster — now with only one working node — as it continues to process messages until it has completed all 1000 requests. See image below which displays cluster activity after it has processed 1000 widgets;
server1was killed during processing.
In the Time to Complete Processing Widget pane, the chart at the far right displays the number of widgets that both servers in the cluster processed. In this case, because we killed one of the two servers during processing, this particular chart appears flat; server 2 performed the bulk of the widget processing.
-
Access your Mule Management Console, click on the Servers tab, then click the name of your cluster to open the Cluster Details screen. In the Nodes Control pane, notice the inactive status of the server you killed, as indicated by the red circle icon (see
Server Ain the image below).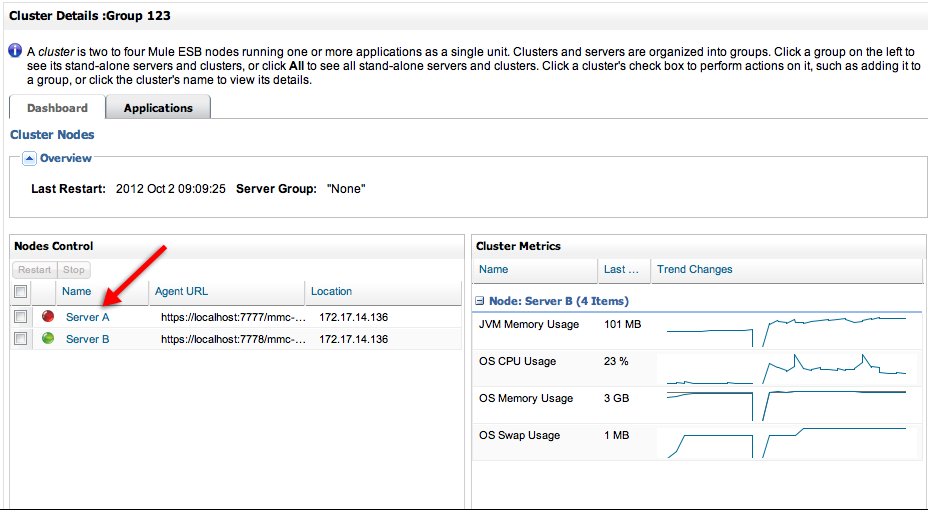
-
To start the stopped server again, access your Terminal or Console, then execute the startServer1 script again.